Excel Dashboard
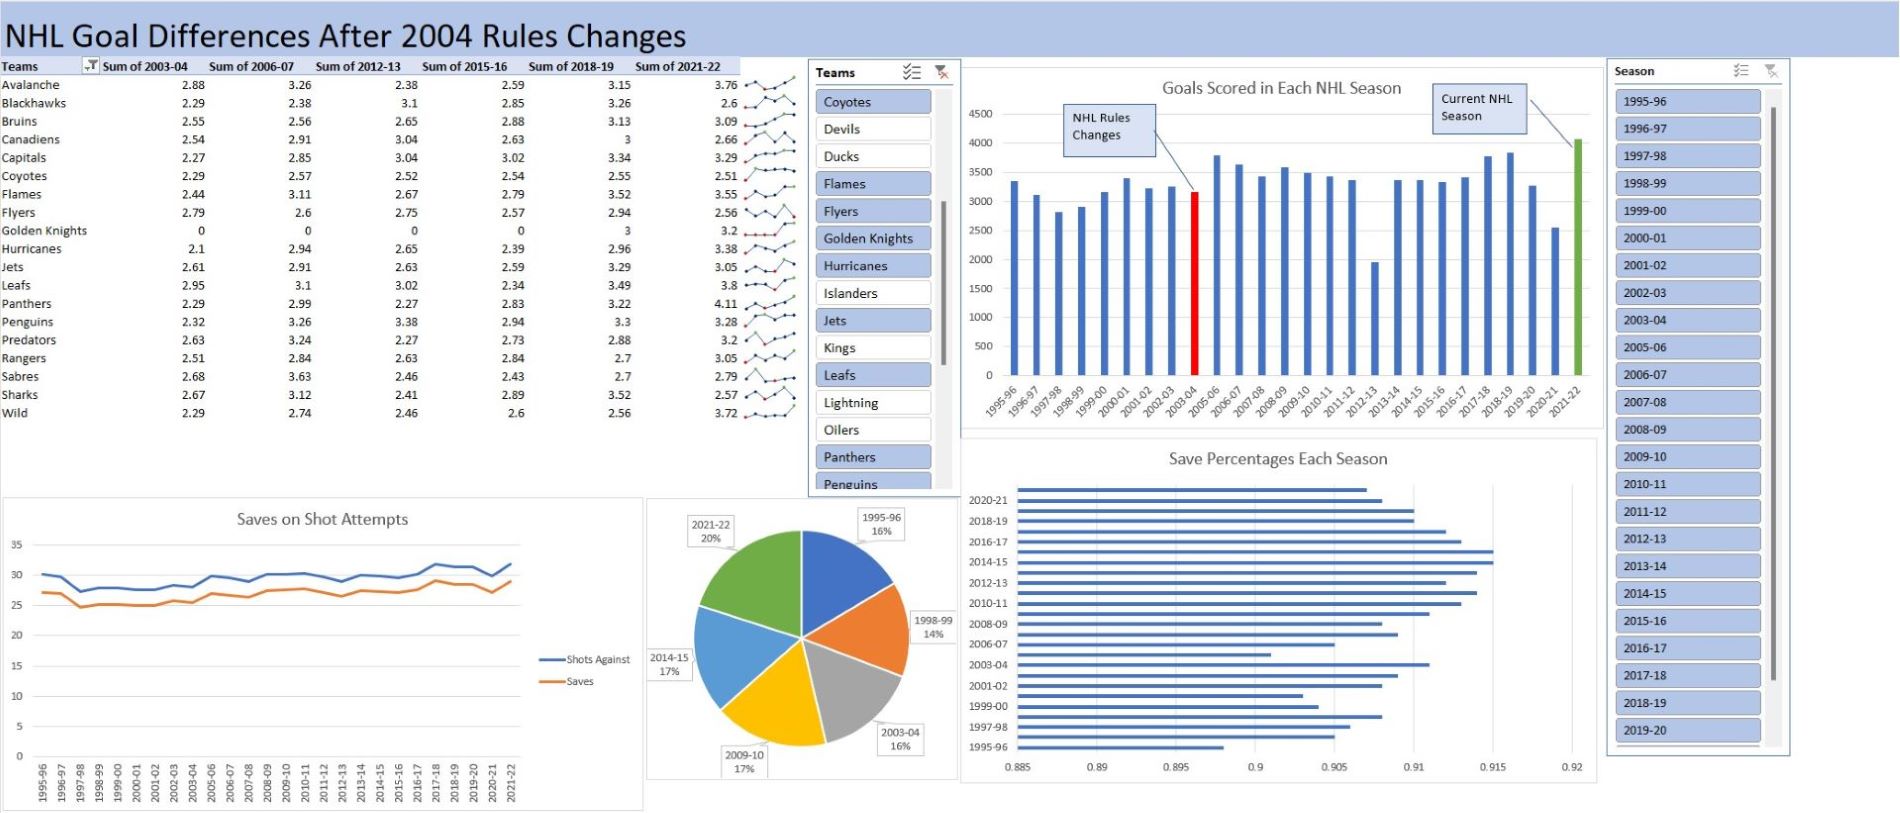
This is an Excel Dashboard I made as a project for my CIS 110 class. This specific dashboard looked to show the relationship of goals scored in the NHL before and after the 2004 rules changes (which included larger offensive zones, smaller goalie equipment, and less stoppages). The dashboard allows users to change the year and choose specific teams to see how the new rules affected goal scoring across the league in different years. (click image to download)


